A new admin-level property, enable.organization.emp has been introduced on the Properties Master screen. If this property is set to On, Associated to Organization field along with
On clicking the Search icon, , the Organization Search List gets invoked. The Organization Search List displays Organization Name and Address details. The Organization Search List has a CLOSE button to close the popup. When any organization is selected from the popup, the selected name is displayed in the Associated to Organization field and the Associated to Organization label becomes hyperlinked. User can click on the hyperlinked Associated to Organization label to invoke Add Organization Employer popup to add new or edit already added details.
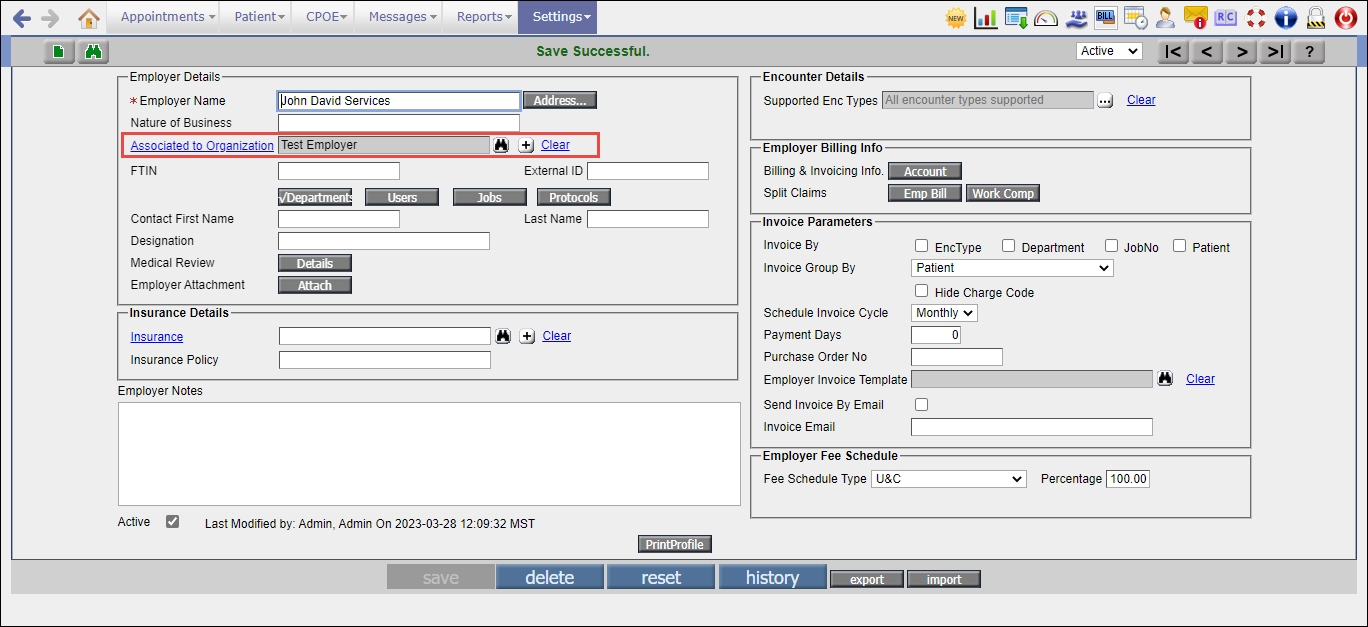
Figure: Associated to Organization field on the Employer Master screen
On clicking the Associated to Organization icon, the Add Organization Employer popup gets invoked. The Add Organization Employer popup displays “* Indicates Mandatory Field" in the header section. The popup is further divided into two sections which constitute Organization Details and Invoice Parameters.
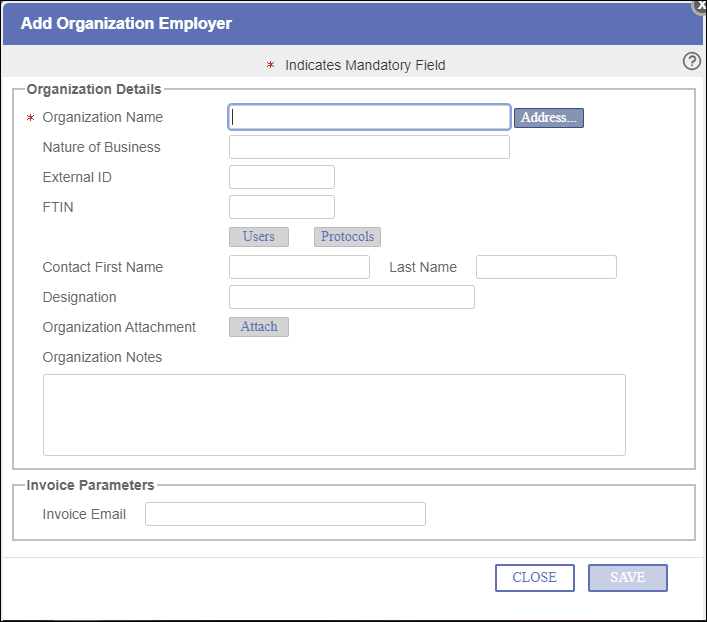
Figure: Add Organization Employer popup
- * Organization Name: Enter Name of the Organization in this field. This is a mandatory alphanumeric field that supports some special characters. The character limit of this field is 50.
 Address... Button: Click on this button to invoke Address for popup. Enter Address details of the Organization Employer in the fields shown. When Invoice Email for Organization Employer is generated, Email specified on the Address for popup gets notified.
- Nature of Business: Type of business of the Organization Employer can be defined in this field. This is an alphanumeric field that supports some special characters. The character limit of this field is 255 characters.
- External ID: This is the ID of the external application from where the Organization Employer is imported. If the Employer is created from PrognoCIS then External ID field can remain blank. This field supports 20 characters.
- FTIN: Enter the FTIN i.e. Federal Tax ID Number for the Organization Employer in this field. FTIN field accepts 9 digits.
- Users Button: While adding the Organization Employer record, Users button is disabled. This button is shown only for those Users who have Employer Portal On for them. Click on the Users button to invoke Users of Employer popup. On this popup, multiple Employer Users can be associated to Organization Employer for Employer Portal.
- Protocols Button: While adding the Organization Employer record, Protocols button is disabled. This button is shown only when the property, use.employer.protocol is set to On. Click on the Protocols button to invoke Protocol(s) for popup. Protocols set by its respective Organization Employer in this popup are to be followed by the patient.
- Contact First Name: Enter the First Name of the contact person of the mentioned Organization Employer. This field supports 30 characters.
- Last Name: Enter the Last Name of the contact person of the mentioned Organization Employer. This field supports 30 characters.
- Designation: Enter the Designation of the contact person of the Organization Employer. This field supports 30 characters.
- Organization Attachments: While adding the Organization Employer record, the
 Attach button is disabled. Click on the Attach button to invoke Organization Attachments popup. Users can attach Organization Employer related documents on this popup. The types of documents which can be attached are Legal documents, Pricing list, Contracts for Payments, Contract for Invoices, Contracts for Overdue amount.
 - Organization Notes: Enter information or Notes for reference in this field. This is an alphanumeric field that supports special characters. A vertical scrollbar and a horizontal scrollbar are displayed as and when more characters are added to the field. The character limit of this field is 5000.
- Invoice Email: Enter a valid Email ID in this field. Email ID stored in this field is used to send generated invoices by email. The generated invoices are sent to the email ID mentioned in Invoice Email field only when the check box Send Invoice By Email is checked for the Employer to which the Organization Employer is associated on the Employer Master screen.
 SAVE: Click on the SAVE button to save the added or modified data on the Add Organization Employer popup.
 CLOSE: Click the CLOSE button to close the Add Organization Employer popup.
A new admin-level property, associate.cl.loc.emp has been introduced to display Associate Clinic Location field on the Employer Master screen in PrognoCIS for HL setup
Associate Clinic Location field is displayed on the Employer Master screen in PrognoCIS for Hybrid Location setup when the following prerequisites are fulfilled:
- The newly introduced admin-level property, associate.cl.loc.emp is set to On on the Properties Master screen.
- HybridLocationAccess checkbox is checked on the User Role Master screen for Medic User.
- Medic User for which the User Role has been assigned logs in and navigates to the Employer Master screen.
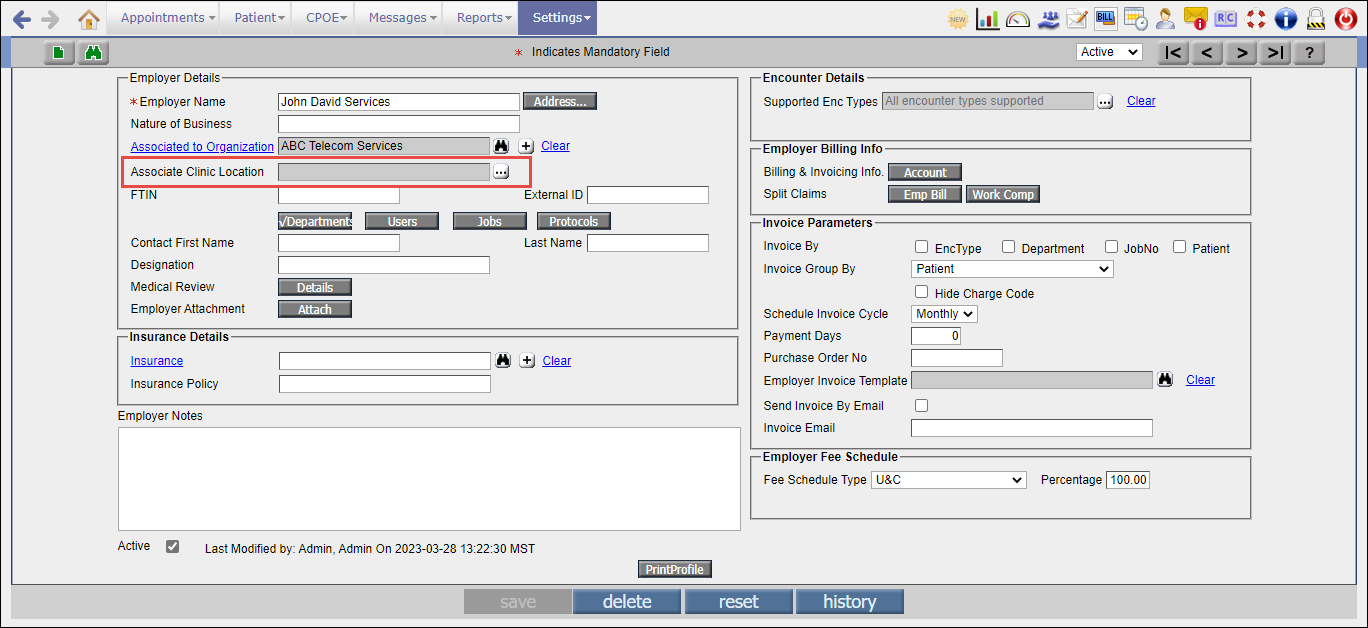
Figure: Associate Clinic Location field on the Employer Master screen
The Associate Clinic Location field is provided with a multiselect icon. Click on the
 popup.png)
Figure: Location(s) popup
If an Employer having locations associated to them has been linked to a Patient on the Patient Registration screen, then on unselecting the selected locations for the same Employer and clicking on the Ok button on the Location(s) popup gives an error message in a popup with an OK button. This error message is displayed on the Employer Master screen and is as follows - There is XXX employees linked to this visit location for (Employer Name). No option to remove.
Changes with respect to Employer on the Patient Registration screen in PrognoCIS for HL setup
For Hybrid Location setup, on adding a new Patient on the Patient Registration screen, all the fields/button/icons/checkbox under the Employer Details section of the Contact tab are shown disabled. This section gets enabled only on saving a newly added Patient record.
If the Clinic Location associated to the Employer on the Employer Master does not match the Visit Location selected on the Patient Registration screen, then on clicking the
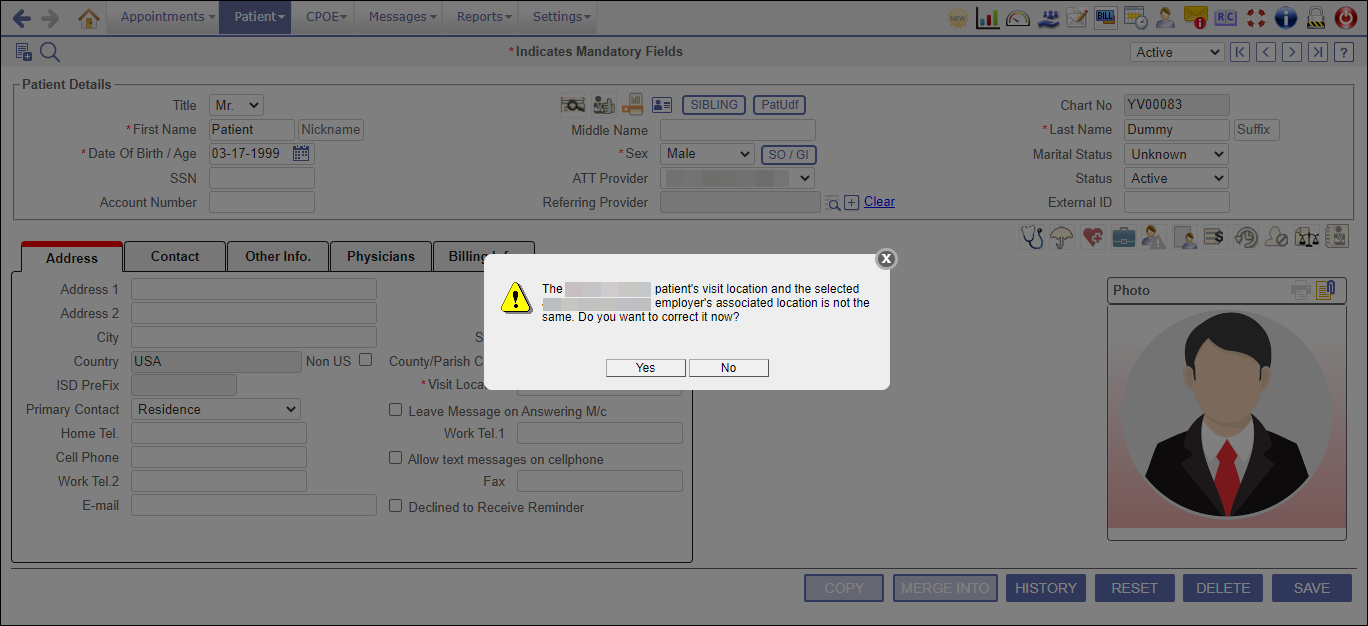
Figure: Validation message for Location mismatch
On clicking the Yes button, the confirmation popup gets closed, and the user is navigated to the Contact tab of the Patient Registration screen. On clicking the No button, the confirmation popup gets closed.
Changes with respect to Employer on the Appointment Schedule screen in PrognoCIS for HL setup
On the New Patient popup, the Employer field along with the Search icon, Clear hyperlink and Employer Notes icon are now disabled.
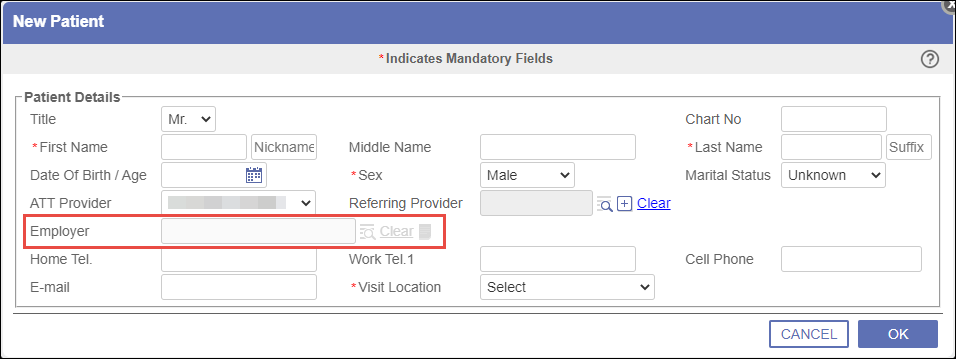
Figure: New Patient popup
Changes made to the Employer Search popup on various screens across PrognoCIS for SL, HL and ML setups
The Employer Search popup now displays two additional columns. These new columns are Organization name and Nature of Business. The existing and new columns displayed from left to right are Employer Name, Address, Organization name, Nature of Business.
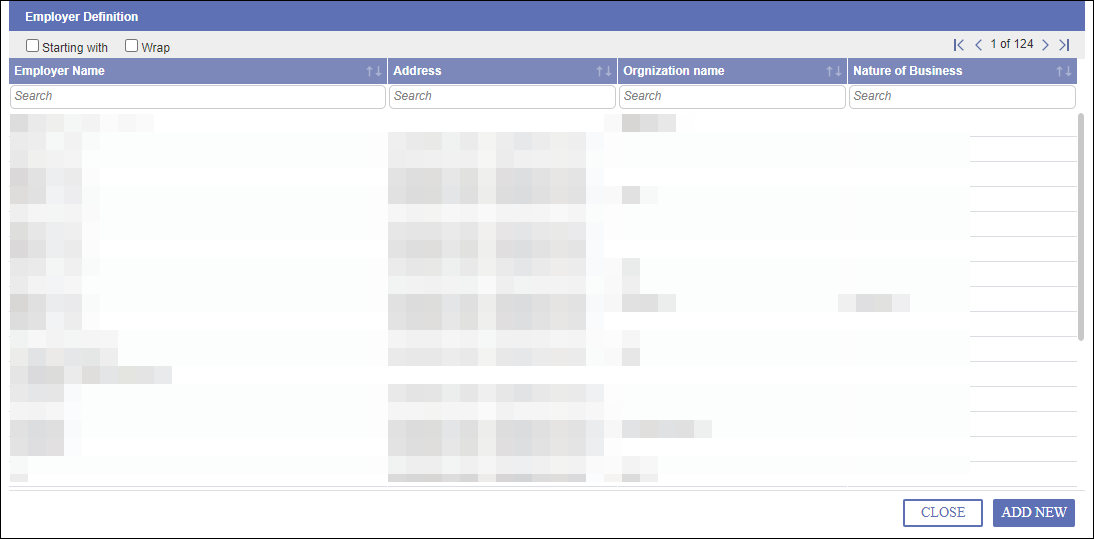
Figure: Employer Search popup
| Time Zone and allowed service states to perform telemedicine is supported for Telemedicine Appointment Schedule in PrognoCIS |
Introduction
The Providers in specific states is allowed to practice Telemedicine service. Until now in PrognoCIS, the functionality of showing the allowed states of telemedicine service was not supported. On introducing this brand-new feature, now the Provider can schedule a Telemedicine appointment based on their or patient’s time zone. Also, now the telemedicine appointment reminder message and email are sent to Provider and Patient is based upon the Provider’s and Patient's time zone. The property prognocis.telemed.timezone.enable enables the Timezone for Telemedicine feature.Added Telemedicine Service States on the Provider Master screen
A new field Telemedicine Service States with a three dotted icon is added on the Provider Master screen. The availability of three dotted icon on the Provider Master screen is governed by the property prognocis.telemed.timezone.enable.
- If the property is turned ON then the Telemedicine Service States icon is displayed on the Provider Master screen.
- If the property is turned OFF then the Telemedicine Service States icon is hidden on the Provider Master screen.
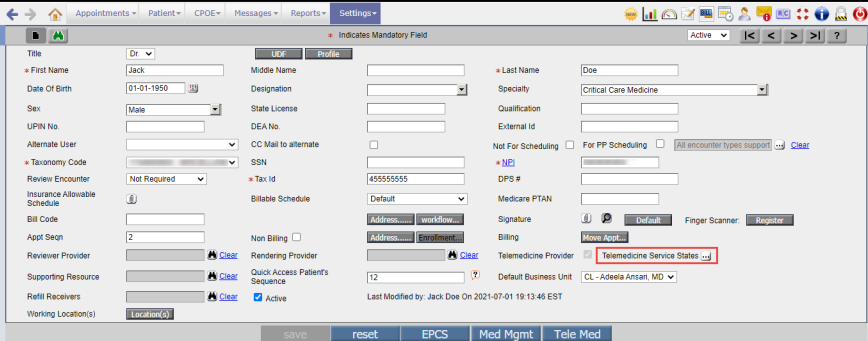
Figure: Telemedicine Service States icon on the Provider Master screen.
On clicking Telemedicine Service States icon, the Allowed states for Telemed popup is invoked. This popup consists of all the applicable allowed states for the Provider to perform telemedicine; here the list of the states is arranged in alphabetical order of the state name. The state mentioned in the Provider’s address is automatically marked as the Home state and keyword Home State as a suffix is displayed. In case, the state is not mentioned in the Provider’s address, the clinic’s state is considered as the home state. From this popup, the User can select multiple states where that Provider is allowed to practice telemedicine. Once the states are selected on the Allowed States for Telemed popup then the selected allowed states are displayed on the top of the table after clicking the Ok button from the popup.
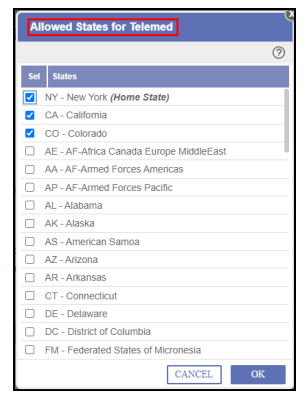
Figure: Allowed States for Telemedicine popup.
Added 'Telemedicine workpattern same as In-Clinic work pattern' checkbox on Work Pattern screen
On the Work Pattern screen Telemedicine workpattern same as In-Clinic workpattern checkbox is added for Telemedicie Provider and by default this checkbox is checked. The user can also uncheck this checkbox, when the checkbox is unchecked then a table is displayed with the Start and End Time column wherein the user can define the time slot for Telemedicine work pattern. Also, added a title as In-Clinic for the existing work pattern table.
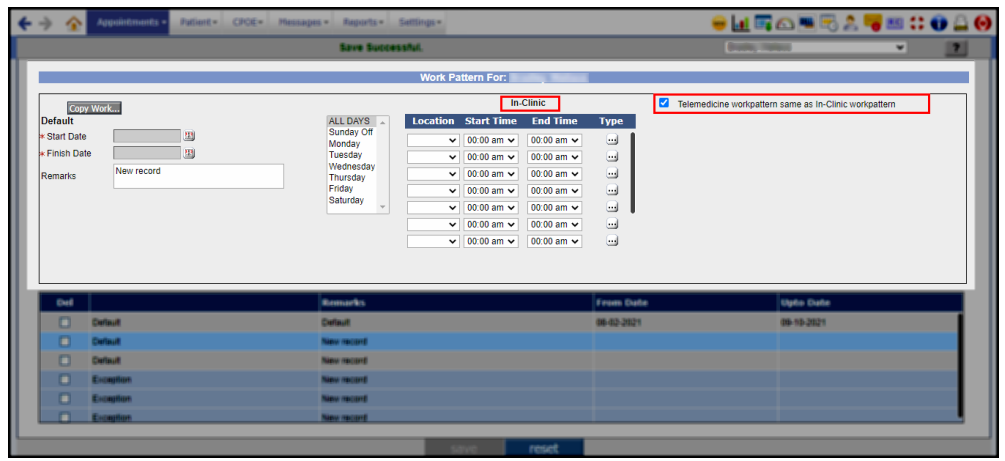
Figure: Telemedicine work pattern same as In-Clinic work pattern checkbox checked.
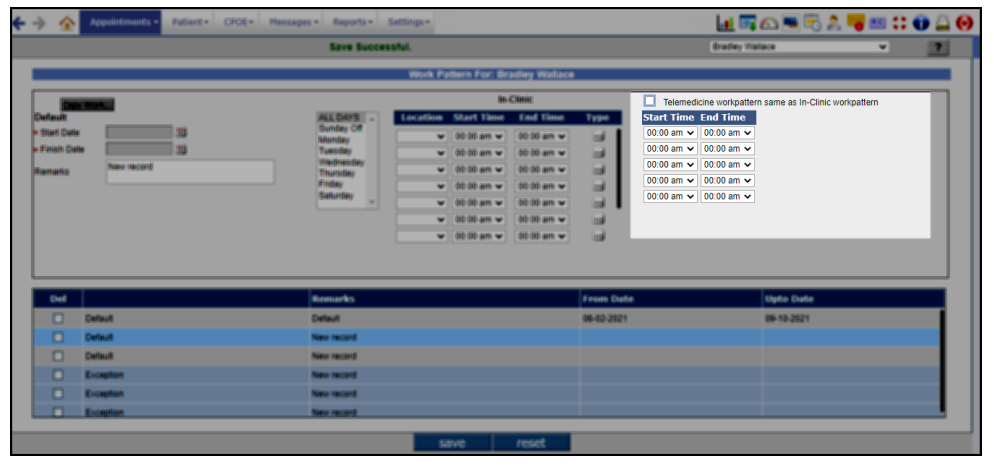
Figure: Telemedicine work pattern same as In-Clinic work pattern checkbox checked.
Added Timezone list box and Allowed telemed service states icon on the Appointment Schedule screen
On the Appointment Schedule screen, a Timezone listbox and Allowed telemed service states icon is introduced. The property prognocis.telemed.timezone.enable governs the availability of Timezone listbox and Allowed telemed service states icon on the Appointment Schedule screen
- If the property is turned ON and allowed telemedicine service state is defined on the Provider Master→Telemedicine Service State then Timezone list box and Allowed telemed service states icon are displayed on the Appointment Schedule screen.
- If the property is turned OFF then Timezone list box and Allowed telemed service states icon on the Appointment Schedule screen are hidden.
- If the property is turned ON and allowed telemedicine service states are not defined, then the Timezone list box and Allowed telemed service states icon are hidden on the Appointment Schedule screen.
Time zone listbox
- On the header band of the Appointment Schedule screen next, a Timezone list box is displayed which displays the different time zones of the states. The time zone list box includes the distinct values of time zones for the states defined in the Allowed States for Telemed popup on the Provider Master screen. (E.g., If the CA-California, NY- New York and NV-Nevada are defined as the allowed telemedicine states of service on the Provider master, then PST and EST are displayed in the timezone drop down list).
- If the states are not defined on the Allowed States for Telemed popup on the Provide Master screen, then the Timezone list box is not displayed on the Appointment Schedule screen.
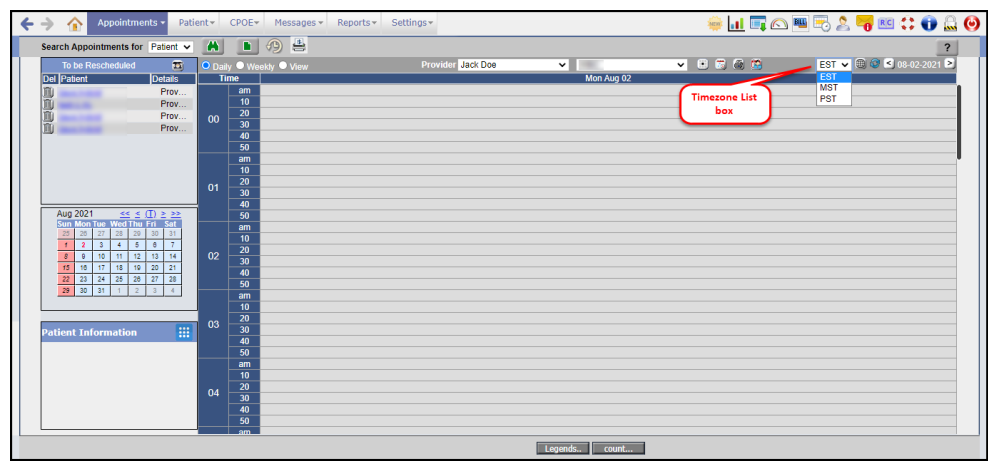
Figure: Timezone list box dropdown menu.
Allowed telemed Services States icon
- The Allowed telemed service state icon is displayed on the header band of the Appointment Schedule screen next to the Timezone list box. On click of this icon, Allowed States for Telemed popup is invoked. This popup consists of one column named as State Code-State-Timezone which displays the State Code followed by a ‘-’ hyphen followed by State followed by ‘-’ hyphen followed by Time zone (E.g., NY - New York - EST). The states displayed here are the states selected on the Provider Master→ Telemedicine Service States→Allowed States for Telemed popup.
- If no states are selected on the Allowed Sates for Telemed popup from the Provider Master, then on the Appointment Schedule screen the Allowed telemed services states icon is not displayed.
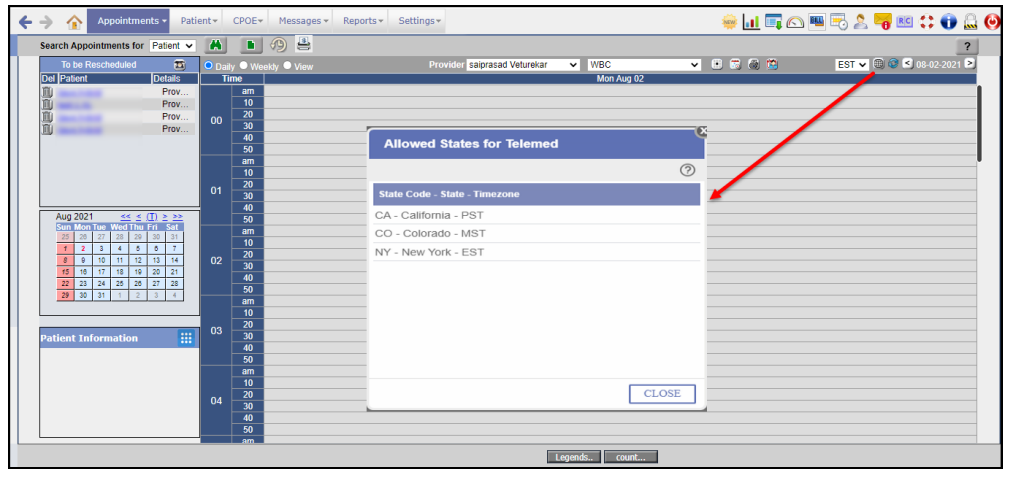
Figure: Allowed Telemed Service States icon on the Appointment Schedule screen.
A new property is added on the Properties screen as telemed.appointment.special.condition to validate on scheduling an appointment when the Patient's home state is not part of the provider’s allowed states. This property has two values i.e., 0 - No Restrictions and 1 - Patient's home state should match the provider's allowed telemed states.
- If the property prognocis.telemed.timezone.enable is turned ON and the property telemed.appointment.special.condition is set to 0, then the user is allowed to schedule an appointment for a patient with any state location and provider with any location.
- If the property prognocis.telemed.timezone.enable is turned ON and the property telemed.appointment.special.condition is set to 1, then the user is allowed to take an appointment for a patient with the provider who has the patient’s home state in the list of allowed states of telemed service. If the patient’s home state is not part of the provider’s allowed states, then in this case when user tries to schedule an appointment then a validation message is displayed on the screen as ‘Provider is not allowed to practice in patient's home state for this telemedicine appointment. Do you want to proceed?.’ to confirm if user wants to proceed even if the states do not match.
- If the prognocis.telemed.timezone.enable is turned OFF and the property telemed.appointment.special.condition is set to 0/1, then the user is allowed to schedule an appointment for a patient with any state location and provider with any location.
The time displayed in the time slot region under the Time column on the Appointment Schedule screen is now as per the time selected from the time zone list box dropdown. Also, the appointments displayed in the schedule inside the time slots are now displayed based on the time conversion. If the user changes the time zone from PST to EST as per the example mentioned above, then the appointments displayed in the slots now move to the new slots based on time conversion from PST to EST. E.g.: If there was an appointment for a Patient A at 10 AM PST, then this appointment now is displayed in the 1 PM EST slot.
As per the existing functionality the property appointment.location_default_color, decides the time slot region color and the text displayed in the time slot region is governed by the existing property appointment.locationdisplay.applicable. Hence, if the work pattern is defined for the Provider from the Work Pattern screen, the time slots region on the Appointment Schedule screen displays the color based on the existing property appointment.location_default_color. Also, the text displayed in the time slot region is governed by the existing property appointment.locationdisplay.applicable.
Through this feature now when the Telemedicine work pattern is defined for a Provider on the Work Pattern screen, then on the Appointment Schedule screen, the time slot region includes the Telemedicine as a word for which the telemedicine work pattern is defined. Below is the list of scenarios:
For In-Clinic Work Pattern
If only the In-clinic work pattern is defined, then the text is displayed on the appointment slot region based upon the value set in the appointment.locationdisplay.applicable property.
In-Clinic and Telemedicine Work Pattern:
When In-Clinic and Telemedicine Work Pattern is defined for a Provider. In this case there are three sub scenarios i.e.,
- Telemedicine work pattern time slot is a part of In-Clinic work pattern time
- Telemedicine work pattern time slot is not a part of In- Clinic work pattern
- Telemedicine work pattern time is partially part of In-Clinic work pattern.
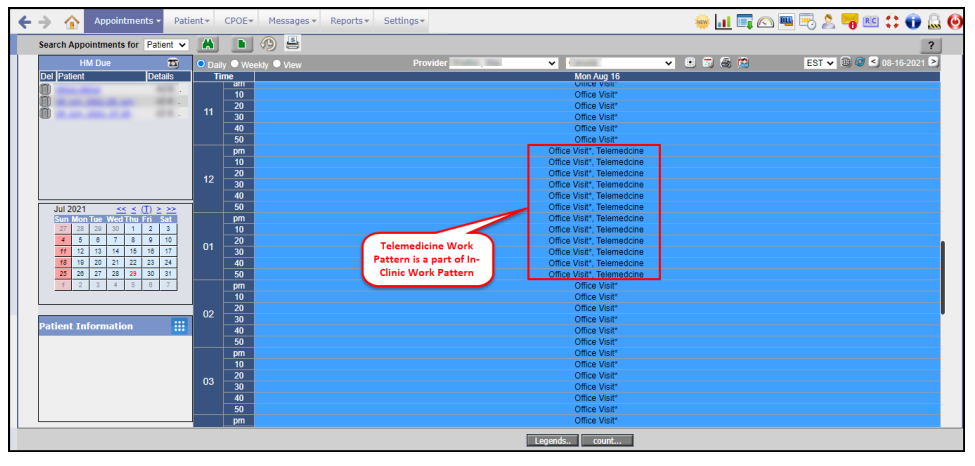
Figure: Telemedicine work pattern is part of In-Clinic work pattern.
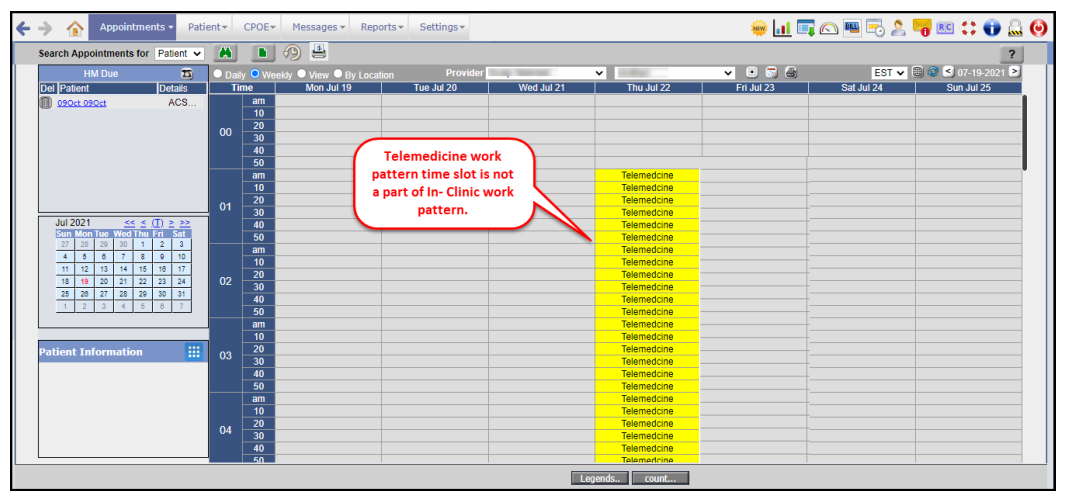
Figure: Telemedicine work pattern time slot is not part of In-Clinic work pattern.
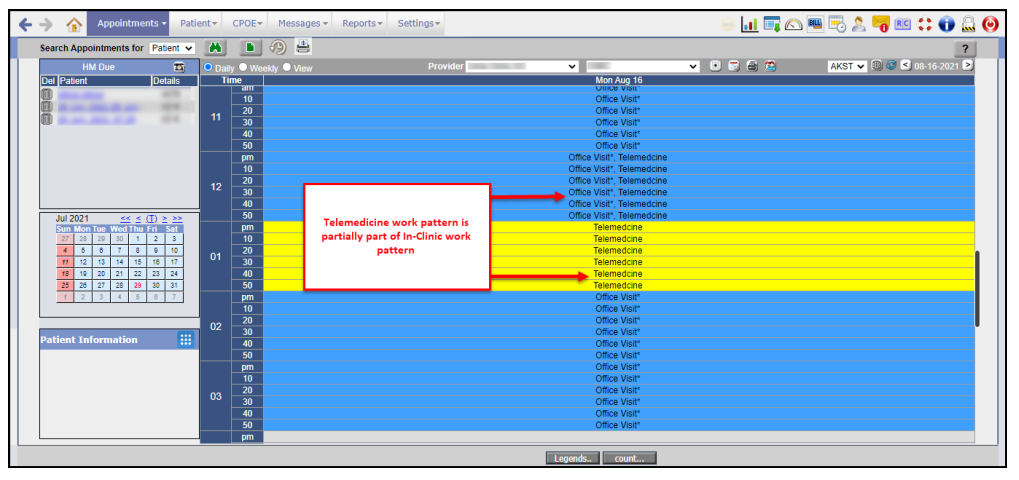
Figure: Telemedicine work pattern is partially part of In-Clinic work pattern.
With this feature some changes have been made in the appointment reminders as well. When the Telemedicine appointment is scheduled, the patient and provider receive a Message and an Email Reminder for the scheduled Appointment, based on the time zones they are situated in. The appointment time in the text and email reminder is displayed as per the military clock, that is, the 24 hour clock pattern. E.g An appointment is scheduled by the clinic at 17:15 MST time zone, patient is located at PST time zone whereas Provider is from EST time zone then Patient receives text/email reminder at 16:00 PST time zone and Provider at 19:00 EST time zone.
Refer below to watch the complete video of this feature:
| Patient Insurance New UI |
Introduction
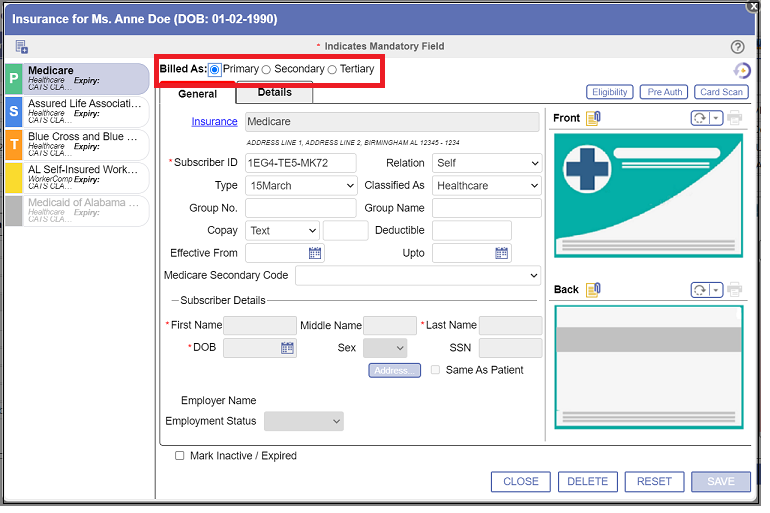
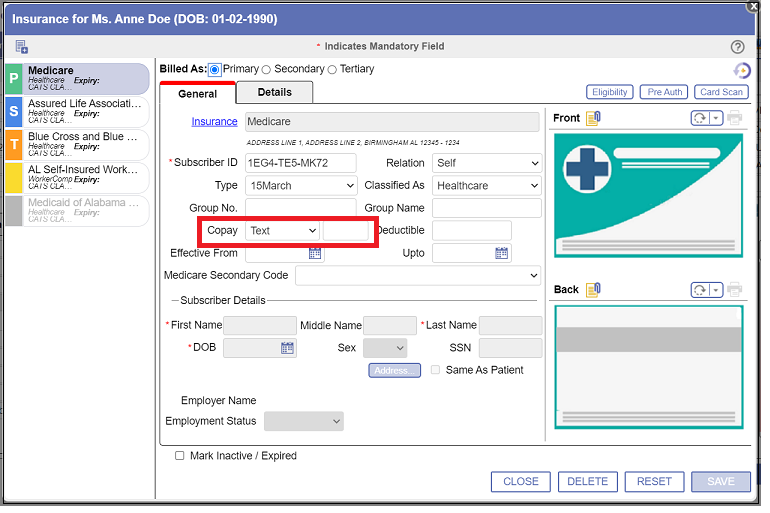
In order to make the PrognoCIS Patient Insurance more user-friendly, a new UI has been introduced for this popup. The Patient Insurance popup can be invoked by clicking on the umbrella icon from multiple screens from EMR and Billing.In this newly revamped Patient Insurance popup, following major changes have been made:
- The screen layout has been changed.
- The screen is now divided into 2 separate panes, the Left Pane and the Right Pane.
- Instead of showing a list of Insurances for a patient in a table at the bottom of the screen, they are shown vertically aligned in the Left Pane; details of each Insurance are shown in the Right Pane, beside the list.
- Instead of showing the Insurance card images at the bottom right corner, they are shown next to the Right Pane. Both Front and Back images are displayed one below the other.
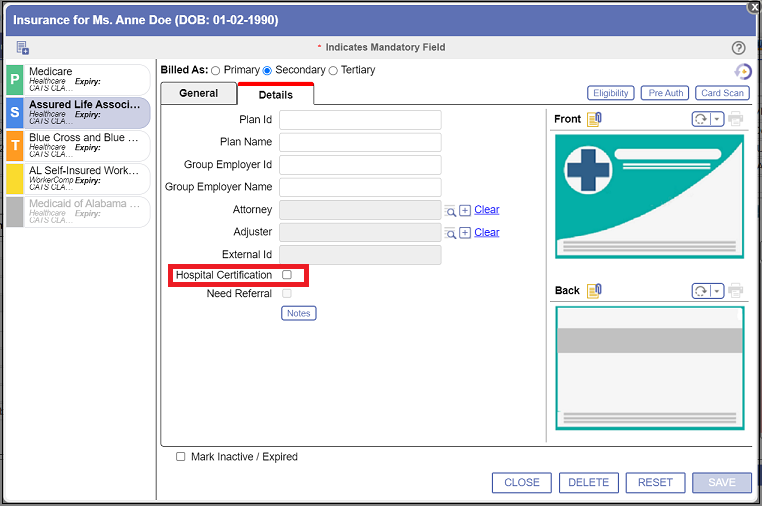
- There are two tabs introduced: Tab 1 and Tab 2, General Tab and Details Tab respectively. Here, the most commonly needed Insurance information is shown in Tab 1, i.e. the General Tab and less frequently needed information is shown in Tab 2, i.e. the Details Tab.
- This UI has introduced a new way to add Insurance for a patient by using the popup named New Insurance for <Name of Patient>. To know more about adding new insurance from this popup, refer to the video.
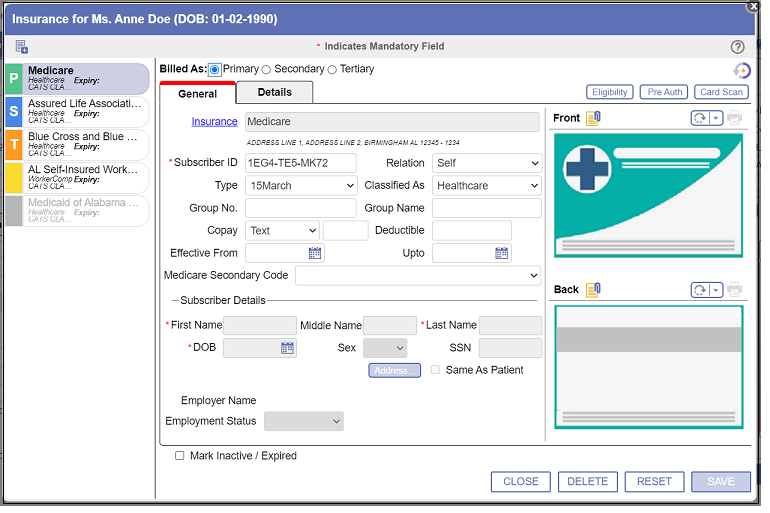
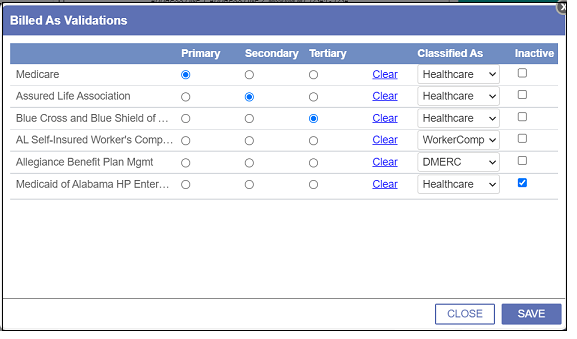
- Default Ins. Primary, Secondary, Tertiary is now called Billed As Primary, Secondary, Tertiary.
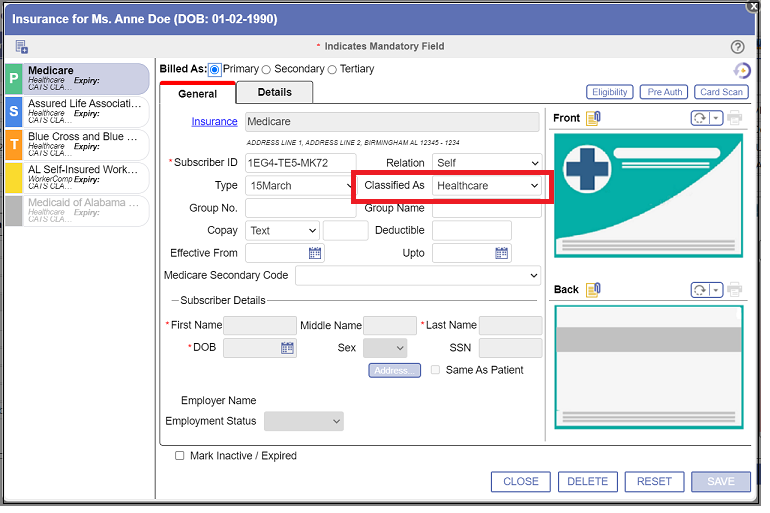
- Defined as is now changed to Classified As.
- A new Classified As option, Healthcare, is now introduced that clubs the Classified As Primary, Secondary and Tertiary in one.
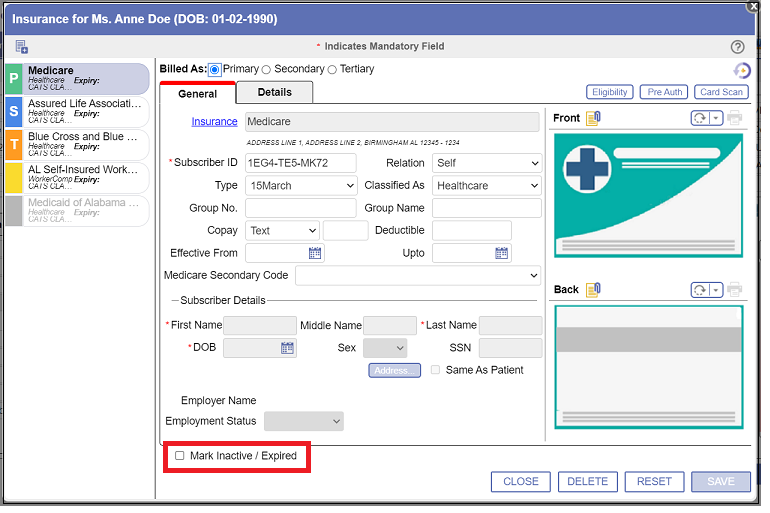
- Status dropdown now changed to Mark Inactive/Expired Checkbox.
- CoPay radio buttons are now converted to a dropdown.
- Hosp Cert checkbox is now renamed as Hospital Certification.
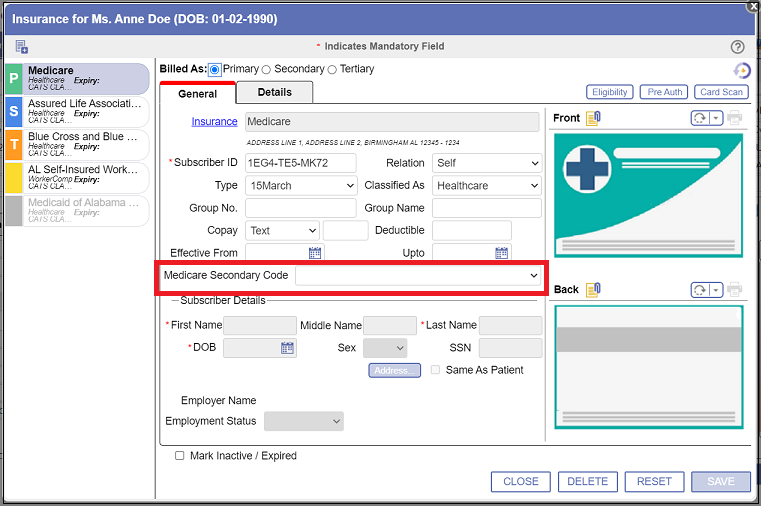
-
The field Code for Medicare as Sec. is now renamed as Medicare Secondary Code.
| Sharing Progress Notes and Letters on Portals |
Introduction
Now, sharing Progress Notes to Employer Portal and sharing Letters to Patient Portal, Employer Portal, Attorney Portal and Referring Provider Portal is quicker, easier and secure with the following features.- Progress Notes can now be shared automatically on the Employer Portal from PrognoCIS on Encounter Close, saving additional clicks and time. Click here for more details
- Letters can now be shared on the Patient Portal, Employer Portal, Attorney Portal and Referring Provider Portal directly from the Letters Out screen. This feature allows the Users to share PHI in a highly secured way. Click here for more details.
| Electronic Prior Authorization (ePA) |
Introduction
Electronic Prior Authorization (ePA) integrates directly with EHR and Pharmacy software, enabling prescribers, specialty pharmacists and technicians to quickly and easily obtain prior authorizations so patients can start their medications sooner and prescribers can have hassle free ePrescription process. PrognoCIS EMR now supports Electronic Prior Authorization (ePA) via Surescripts.- For more information on Electronic Prior Authorization (ePA) click here
- To view Instruction steps for a successful ePA cycle click here
| New E&M Introductory Guidelines for Code 99202-99215 and 99211 to 99215 |
Introduction
Evaluation and Management coding (commonly known as E/M coding or E&M coding) is a medical coding process by which the Encounters are translated into CPT codes to facilitate billing. This allows medical service Provider's to document and bill for reimbursement for the services which they have provided to Patient. E&M codes are based o n the Current Procedural Terminology (CPT) codes and G codes. E&M scoring is based on Patient’s Past Medical History, Examination and Medical Decision making (MDM). In PrognoCIS, following changes have been made in the E&M Introductory Guidelines related to Office or Other Outpatient Codes 99202 to 99215 and the E&M Revised Office or Other Outpatient E&M Codes 99202 to 99215 that are effective from January 1, 2021.
E&M (EVaLUATION AND MANAGEMENT)
There are different E&M codes for
different types of Encounters wherein the billing amount for every encounter depends
on the Level of Service provided by the Doctor. There are pre-defined standards
and parameters to qualify for a level of service. The User has a provision to
click on an option to select a Level of Service. Note that if the Doctor has
spent a significant time in consulting the patient without any ROS/HPI even then
he is entitled to charge a higher level of service.
The following are the pre-defined E & M types in PrognoCIS.
![]() Note:
Note:
On the E&M (Evolution and Management) screen, a revised guideline changes by CMS hyper link is provided. On click of this hyperlink a pop-up is invoked which displays the information related to the New Patient Codes, MDM and Elements.
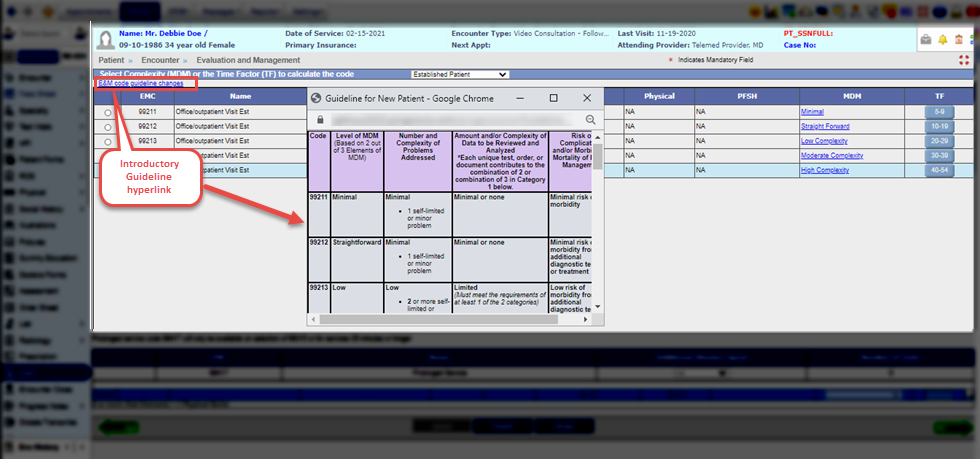
Figure: Introductory Guidelines hyperlink.
In PrognoCIS under the E&M screen, the Encounters dated on or after 01/01/2021, each of the Evaluation and Management code, i.e. 99202 to 99205 and 99211 to 99215 are displayed in a new format for all the Encounter Types. However, for the Encounters prior to 01/01/2021, the codes are displayed in the old format.
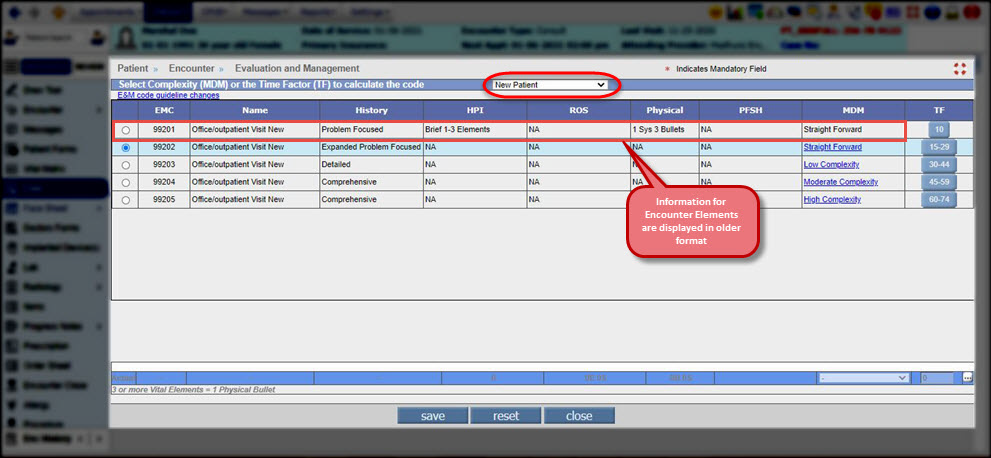
Figure: For code 99201 the Face Sheet elements are displayed in older format.
The EMC (Evolution and Management Code) 99201 for New Patient is not available for use from 01/01/2021. 99201 codes are available for the User to select if the date of service is prior 01/01/2021. For any date of service after 01/01/2021 the 99201 code is not available for selection.
In case, if a User tries to select the code 99201 for any E&M type, then the following alert message is displayed on the screen.
'99201 is not available for selection'.
Figure: 99201 code not available for selction alert.
On the E&M screen, the MDM selection table now does not
displays the information related to the MDM elements such as Type of Medical
History, History of Present illness, Review of System, Physical, Past, Family
and Social History.
Figure: NA displayed under the Face Sheet elements column.
The MDM elements associated with codes 99202 to 99215 consist of three major components - 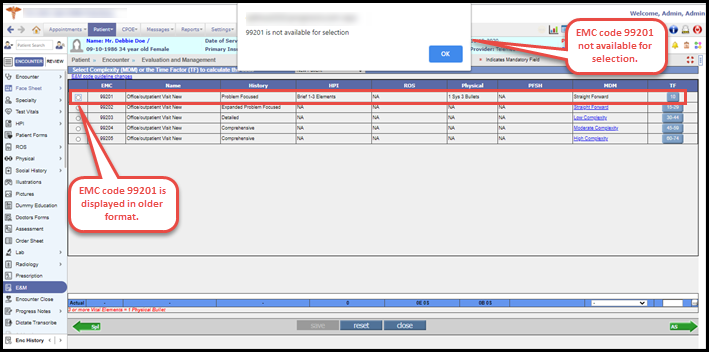
![]() Note:
For New and Established Patient the calculatated MDM section available in the bottom of screen is disabled.
Note:
For New and Established Patient the calculatated MDM section available in the bottom of screen is disabled.
Elimination of Medical Elements
![]() Note:
This
is applicable only for New Patient and Established Patient E&M types.
Note:
This
is applicable only for New Patient and Established Patient E&M types.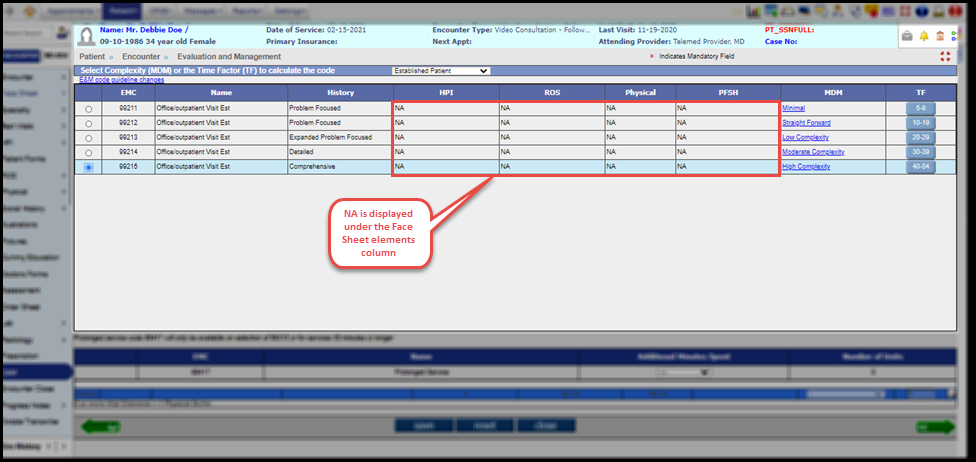
MDM LEVEL (MEDICAL DECISION MAKING)
In order to select a level of the E&M service, two of the three elements must be met or exceeded. The new MDM table in PrognoCIS further outlines the criteria for the E&M code level selection.
The Level of Medical Decision Making is used to assist in selecting the level of medical decision making for reporting an office or other outpatient E &M service code. The table includes the four levels of medical decision making, i.e., Straightforward, Low, Moderate and High and the three elements of medical decision making i.e., number and complexity of problems addressed, amount or complexity of data reviewed and analyzed, risk of complications or morbidity/mortality of patient management.
MDM (MEDICAL DECISION MAKING) Column
The MDM column on the E&M screen displays the level of complexity based on the selected EMC (Evaluation and Management Codes). Now, along with showing the level of complexity, the User has to select other elements related to the MDM. Hence, a hyperlink is provided for each level of MDM.
.png)
Figure: MDM hyperlink.
On clicking the the MDM hyperlink available under the MDM column, the Level of MDM(E.g. Level of MDM-Low Complexity) pop-up is invoked. Here, the User can also select the required complexity of particular diagnosis and make a decision accordingly.
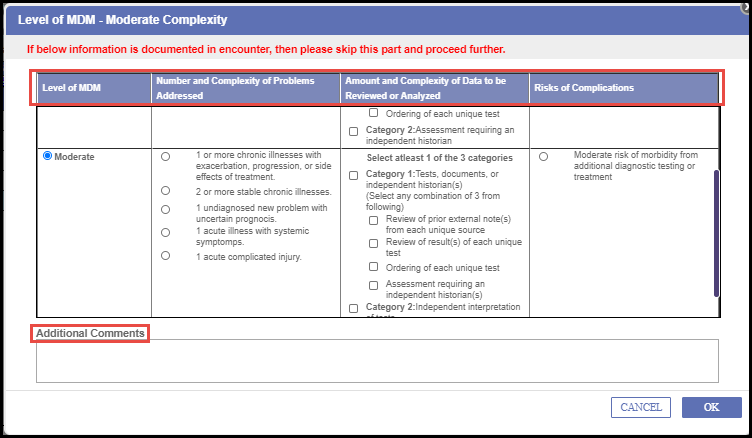
Figure: Level of MDM popup.
The first column of the Level of MDM table displays the Elements of MDM which is by default selected based upon the selected MDM option from the E & M screen.
The second column in the table displays Number and Complexity of Problems Addressed; here the User can select the required category/level of the complexity. Each level of MDM has its own set of elements.
Third column in the table displays the Amount and Complexity of Data to be Reviewed or Analyzed. (E.g. The number of Lab/Radiology test ordered). If User selects information from third column without selecting the required info from the second column then an alert is displayed on screen as 'Please select Number and Complexity of Problems Addressed'
The fourth column in the table displays the Risks of Complications wherein the User has to select the risk of particular surgery or treatment.
Also, an Additional Comments text box field is provided at the bottom of the Level of MDM pop-up. The User can either select the elements of MDM or enter the information in the textbox area or can do both the things. Once the required elements are selected or Additional Comments are added in the textbox area then click on the Ok button to save the changes for each section.
Updated Time Factor
The fourth column in the table displays the Risks of Complications wherein the User has to select the risk of particular surgery or treatment.
Time factor is the duration of time spent face-to-face consulting / counseling the Patient. By default the Time Factor is set to zero. Click on the Time Factor button for the selected EMC code. On clicking TF button, the Time Factor pop-up (E.g. Duration 15 to 25 minutes) is invoked wherein the User can enter the additional notes or comments related to extra time spent for particular encounter under the Additional Comments text box area.
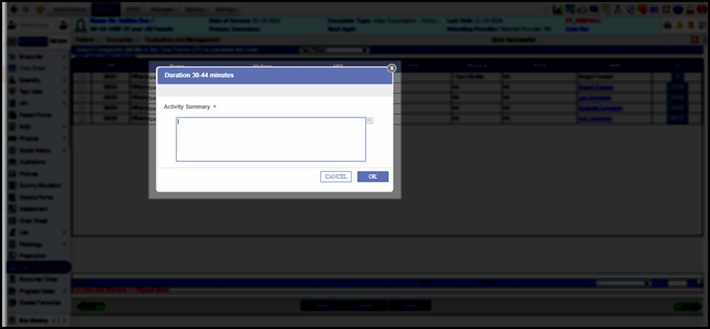
Figure: Time Factor popup.
Added Prolonged Services Code
Prolonged Services code 99417 is available on selecting 99205 EMC code or for an encounter longer than 75 minutes. For every additional 15 minutes spent after 75 minutes the system considers the units for 99417.
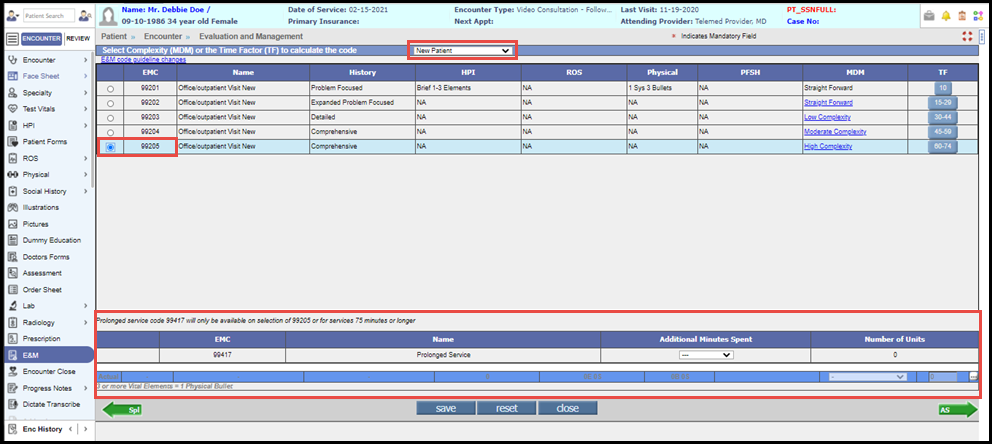
Figure: Prolonged Service code available for EMC code 99205.
The prolonged services code 99417 is also available on selecting 99215 EMC code or for an encounter longer than 55 minutes. For every additional 15 minutes spent, the system considers time units for 99417. It is calculated as 1 unit for every 15 minutes.
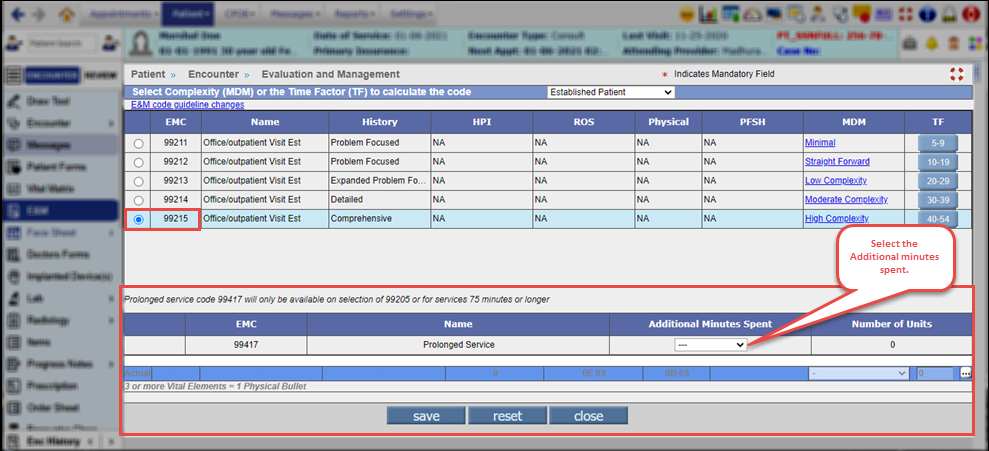
Figure: Prolonged Service code available for EMC code 99215.
- 15-29 Minutes
- 30-44 Minutes
- 45-59 Minutes
- 60-74 Minutes
- 75-85 Minutes
On selecting the additional minutes spent (E.g. 30-44), the units get calculated and the respective unit gets auto populated under the Number of Units column. Once the information MDM or Time Factor is entered for the selected code then click on the Save button and save the changes.

Figure: Calculated MDM section.